Background & Methodology


Where has development been happening in the City of Los Angeles in the past decade?
This project aims to explore this question through looking at a series of indicators that may
help us grasp a better idea of this question.
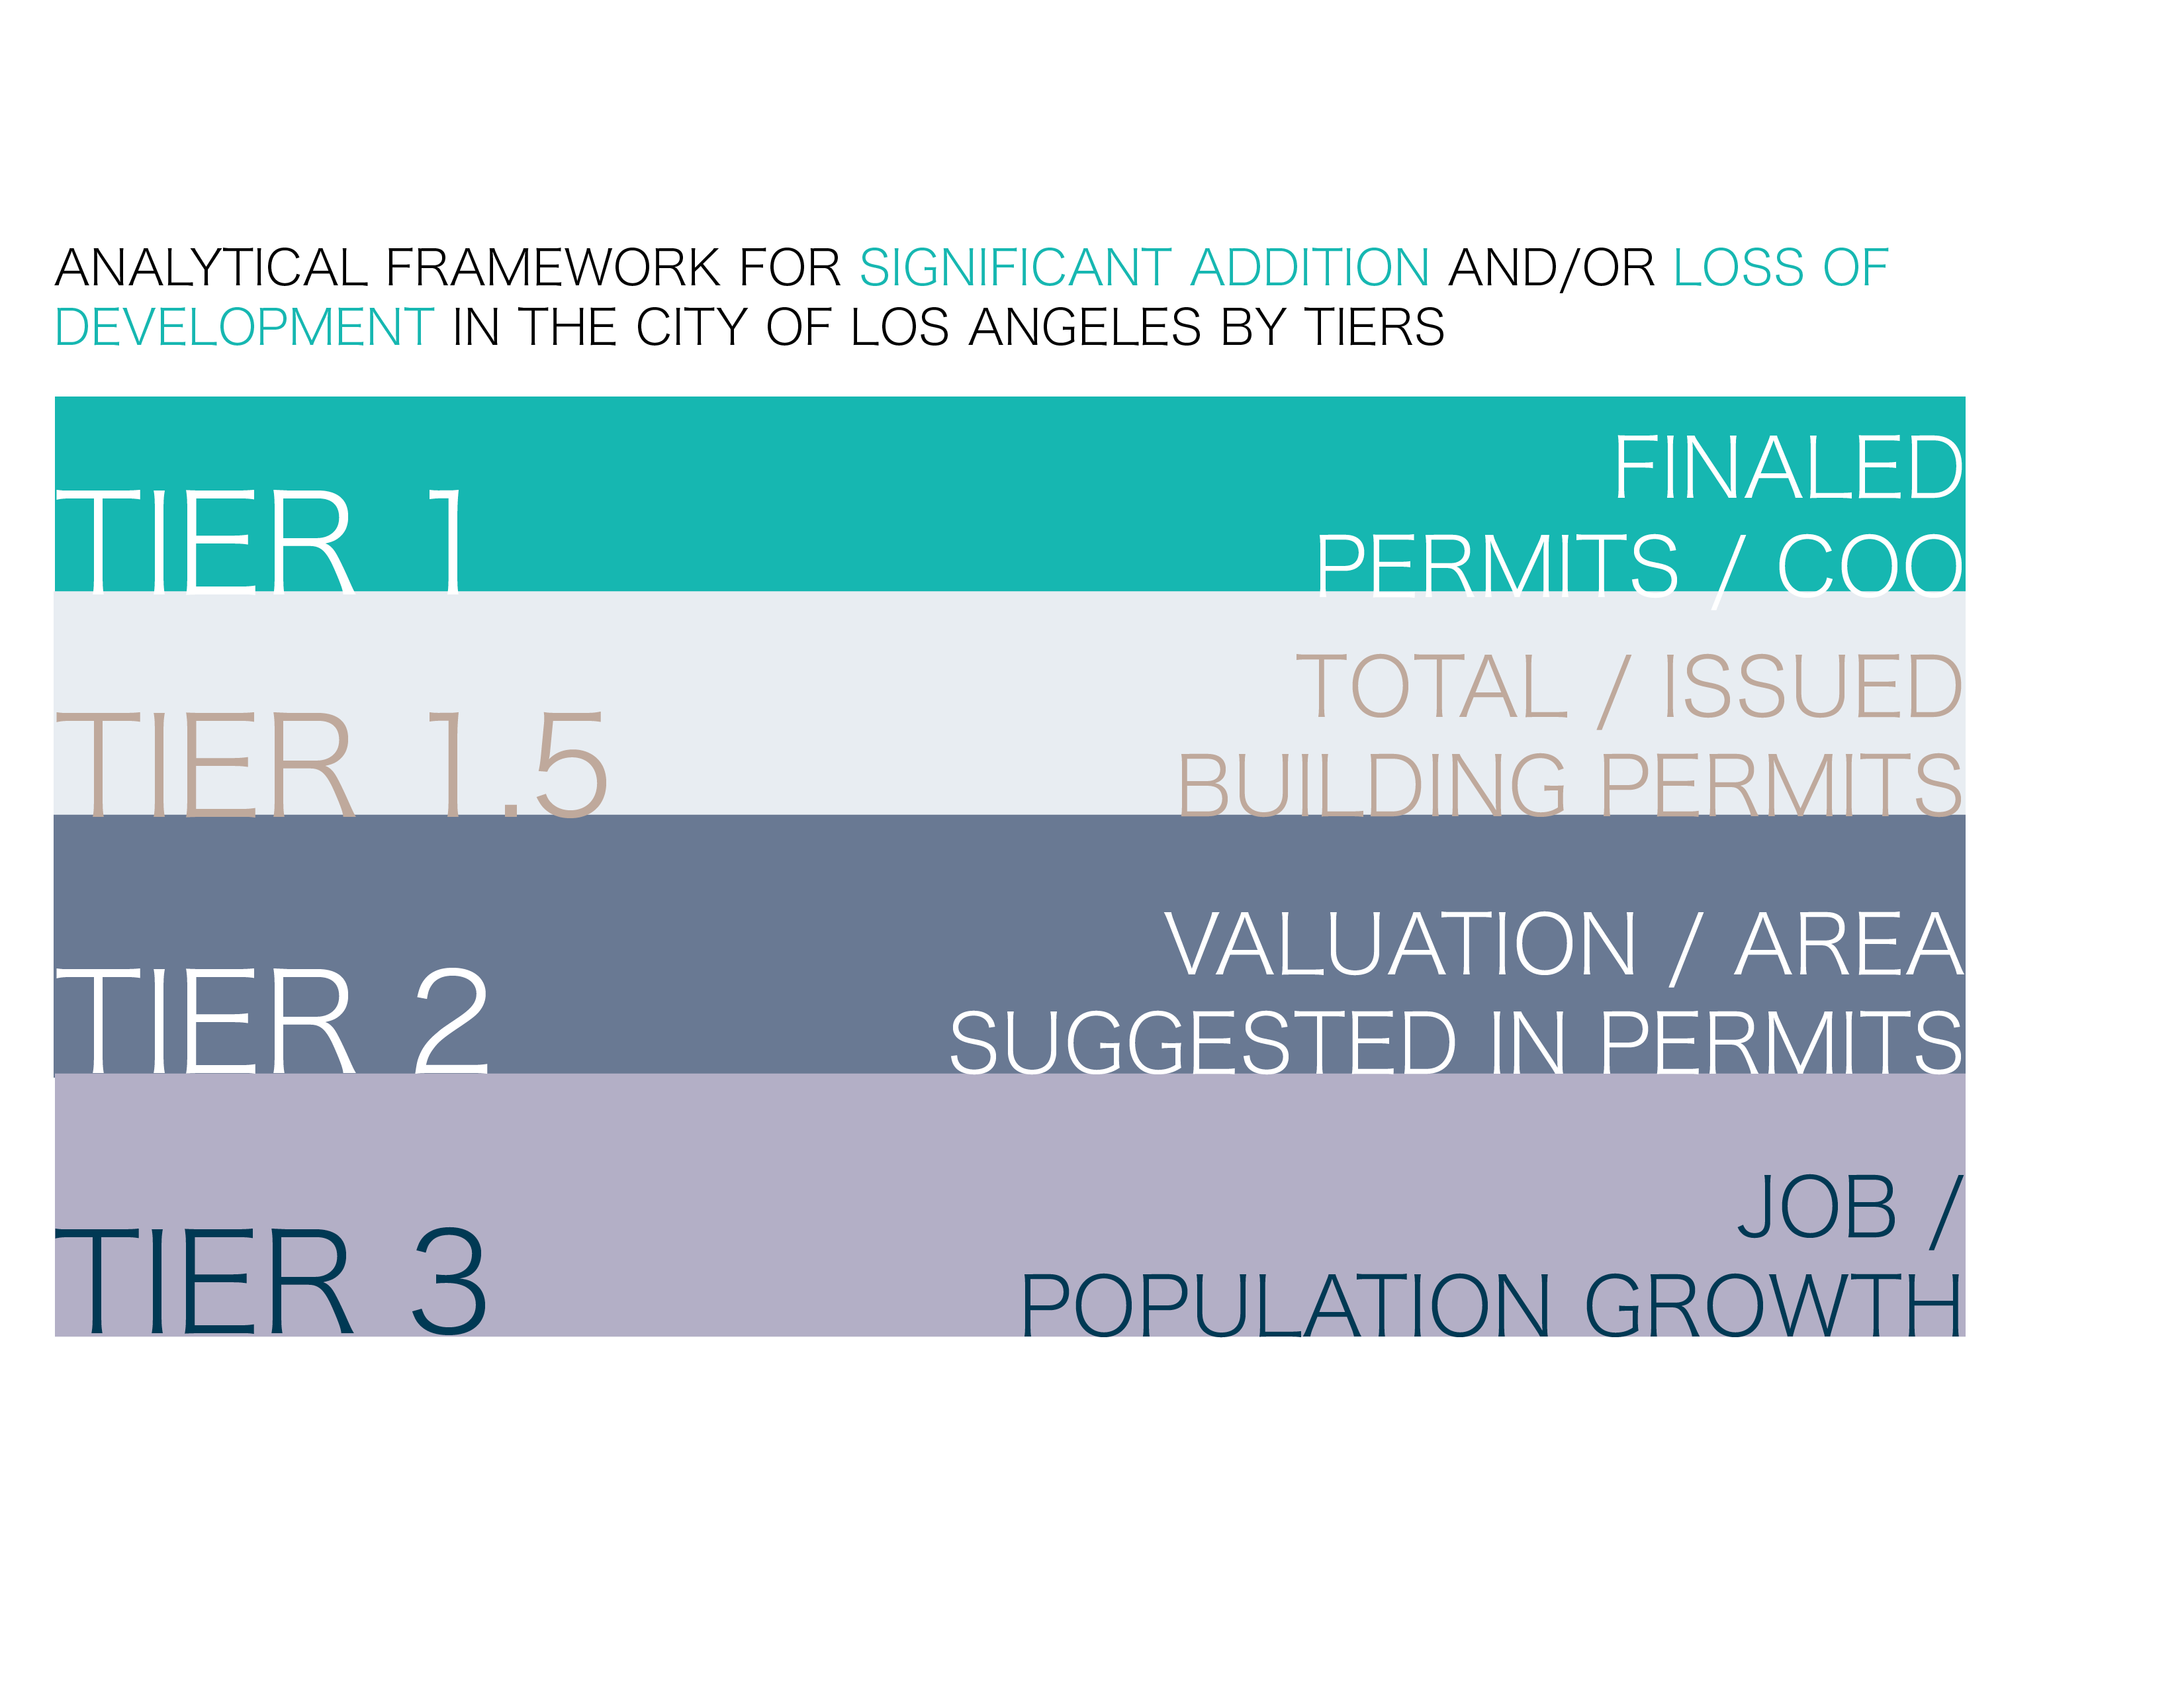
The indicators are grouped and examined by tier 1, 1.5, 2, and 3 – higher tier means more direct
relevance to development activities. Please refer to Diagram on the left.
Tier 1 consists of number of finaled permits and Certificate of Occupancy,
which directly represents completed projects in the city.
Tier 1.5 looks at number of total permits submitted and issued permits, which suggest an overall development interest and hence potential.
Tier 2 contains valuation and area value suggested in building permits dataset. It is placed towards the bottom because of potential missing or outdated data for certain projects, hence, not completely reliable.
Tier 3 is drawn from Census (ACS 5 year estimates) and Census on the Map on population and job growth over the periods of study. This is a relatively indirect indicator of where development or growth has been happening.
In addition, Zillow Housing Value Index is referenced but not included in the modeling process, primarily due to absence of a reliable geographic reference of neighborhoods listed on Zillow using Community Planning Area (CPA) or Neighborhoods, both of which are officially established by the City of Los Angeles.
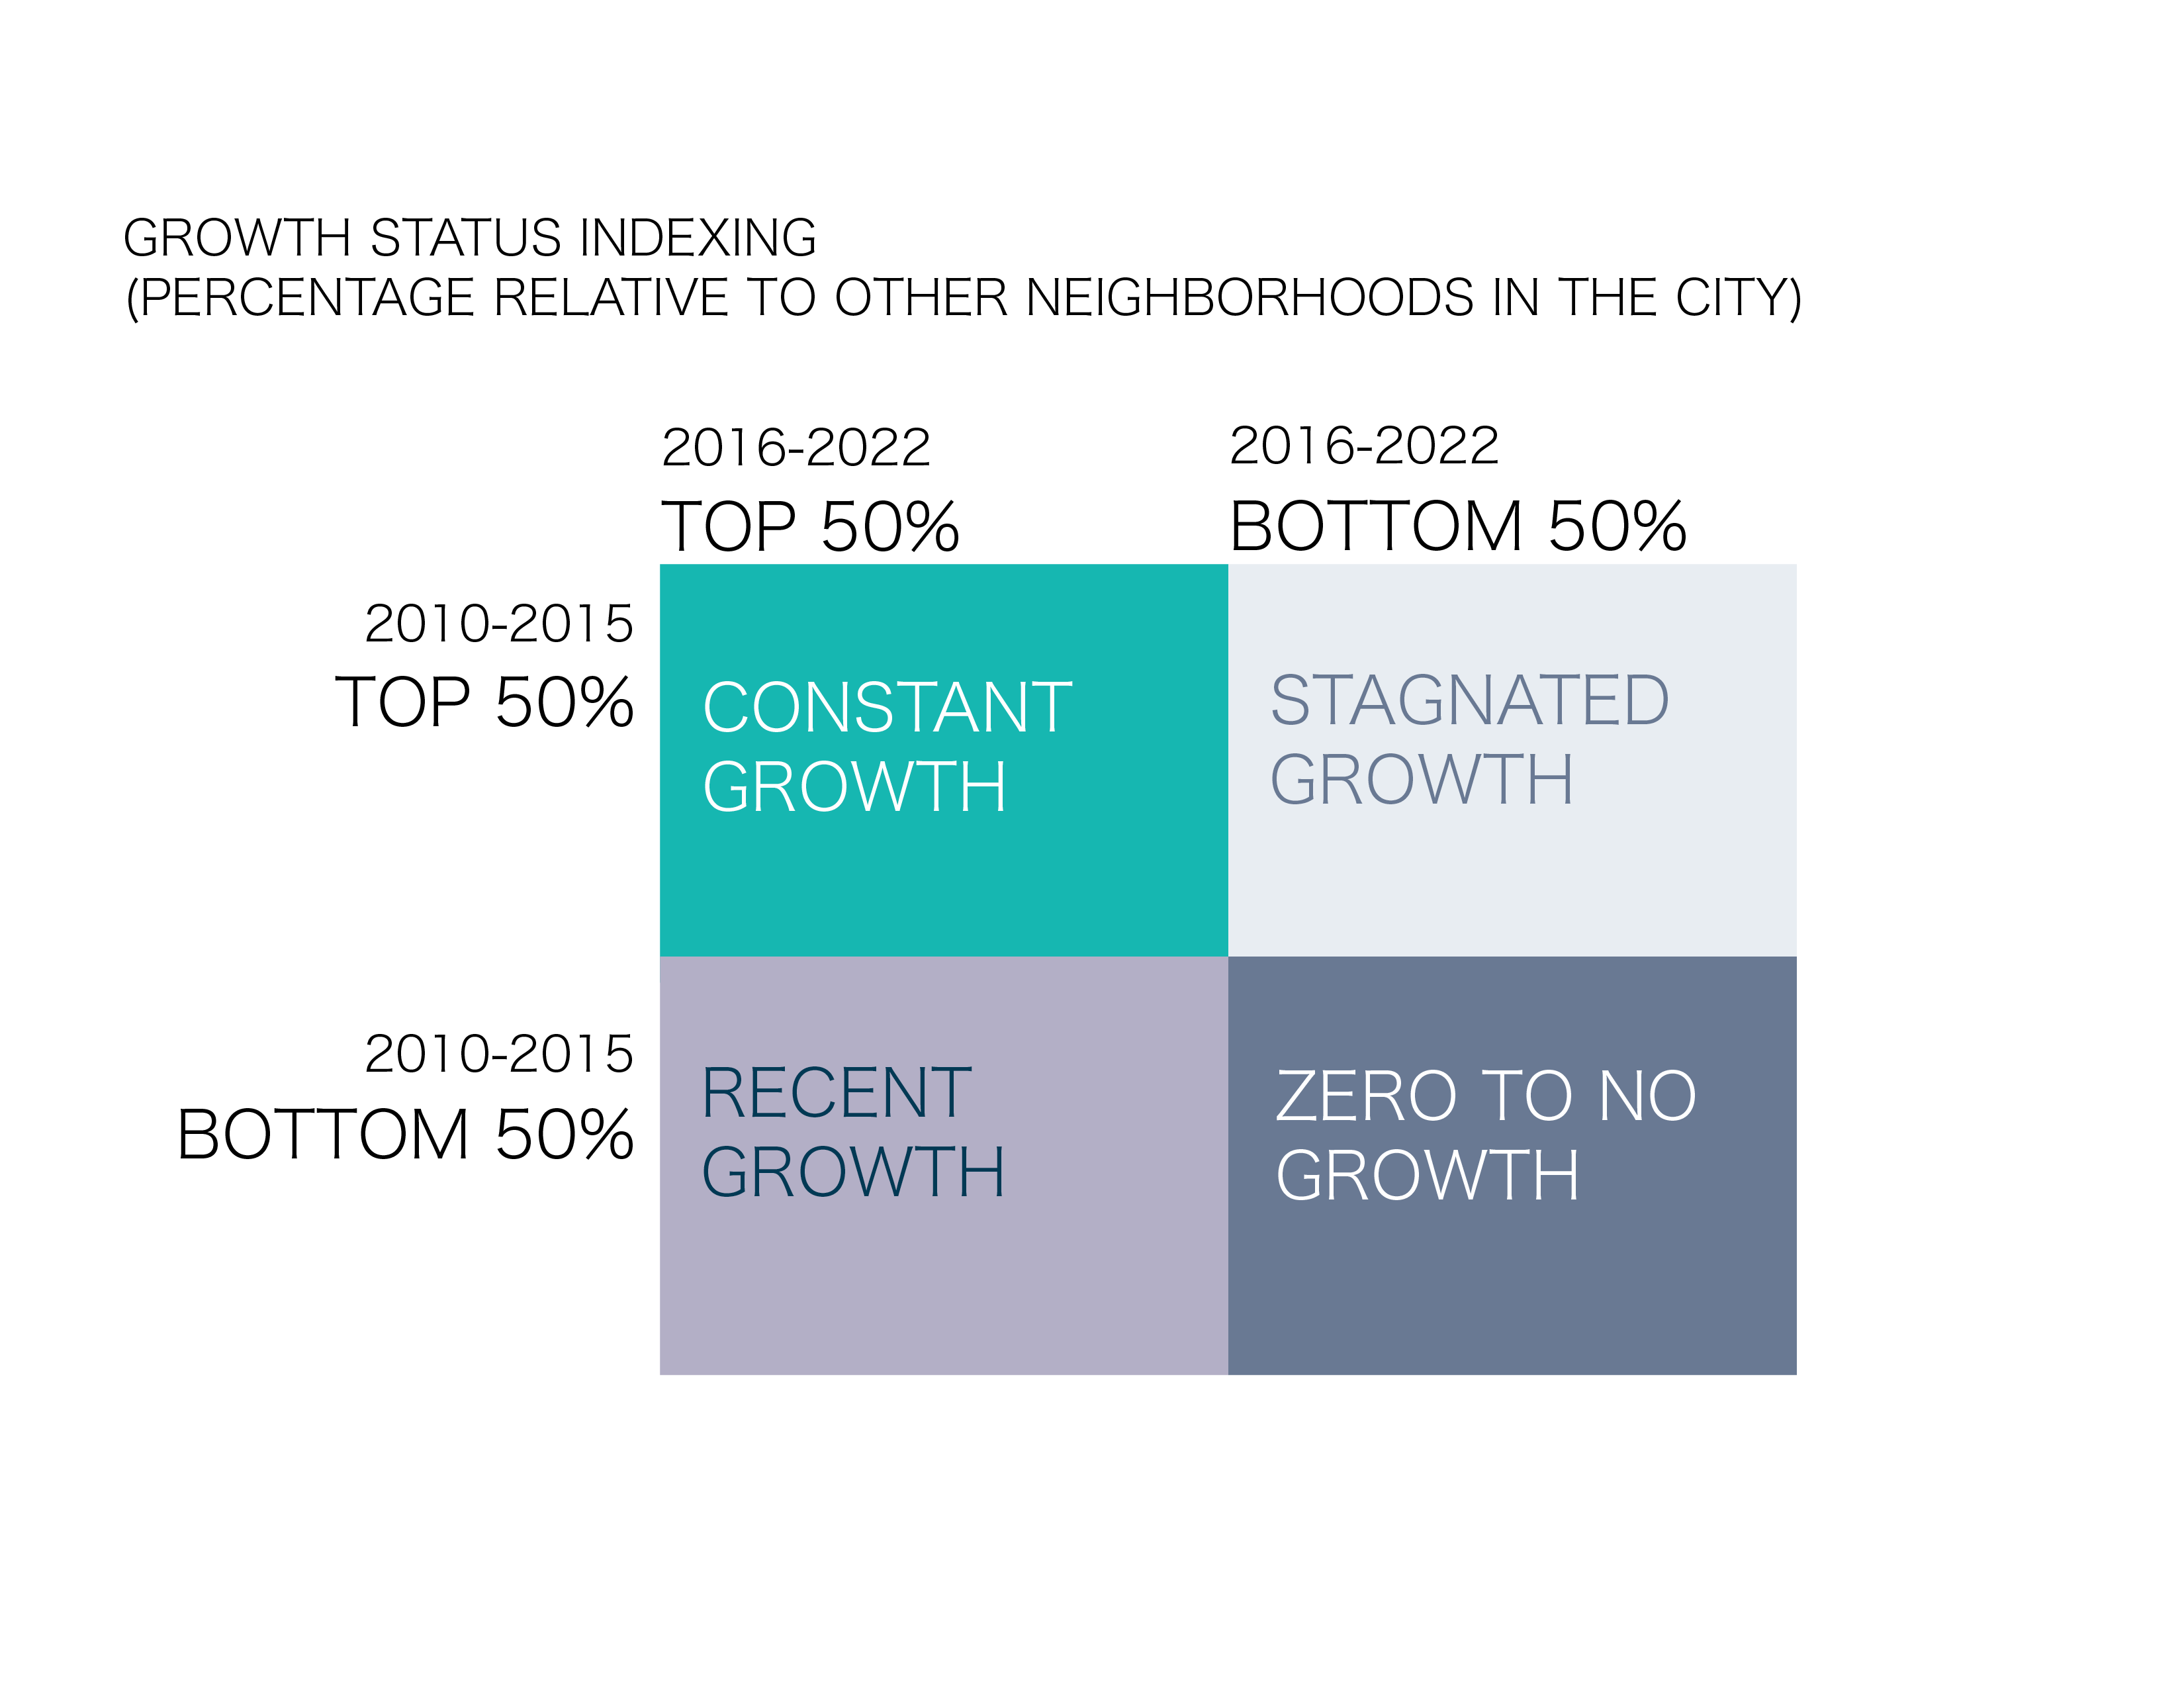
How should we characterize growth and stagnation of development in Los Angeles? In this project, development from 2010 to 2022 is examined at a neighborhood scale and categorized into 4 groups listed below:
- Neighborhoods with constant development through out (2010 - 2022)
- Neighborhoods underwent development in recent years (2016 - 2022)
- Neighborhoods underwent development in early 2010's but stopped midway (currently stagnated or slowed down) (2010 - 2015)
- Neighborhoods experienced little to no development
Note that the development growth in individual neighborhood is examined relative to the rest in the city -- this is for better directing attention and resources to those 'relatively under' developed neighborhood within the City. Trends would be very differently if put on a national scale. Using indicators identified in tiers, neighborhoods are assessed by scoring in the two time frame (2010 - 2015 and 2016 - 2022) -- if one falls in top 50% that is 1 point, bottom 50% means 0 point. If one scores 1 in both time frame, that suggests a constant growth, opposite means little to no growth. The 4 categories can be illustrated by the diagram on the right.
For results of this development assessment, jump to Development Map. If you wish to learn more about selection of geographic area and data sources, refer to Scope & Data. For more data exploration, visit Data at a Glance.