Part II - Street Networks and Accessibility

This part aims to push further with the analysis of spatial distribution of arts and cultural amenities and look at their accessibility. Due to the limited scope of this project, the analysis may not involve the whole existing dataset, but rather, a small part of data is used for demonstrating purpose.

Code
# Packages

import xarray as xr
import hvplot.pandas  # noqa
import hvplot.xarray  # noqa
import cartopy.crs as ccrs

import pandas as pd
import numpy as np
import altair as alt
import geopandas as gpd
import hvplot.pandas
import numpy as np
import pandas as pd
import seaborn as sns
from matplotlib import pyplot as plt
import datetime
import math

%matplotlib inline

import plotly.express as px
from plotly.offline import init_notebook_mode, iplot
import plotly.graph_objects as go
from plotly.subplots import make_subplots

import osmnx as ox
from shapely.ops import unary_union
import panel as pn
Code
# Load Data

# NYC

# Neighborhoods Geo
NYC_Neighborhood = pd.read_csv("./Final_Data/1/2020 Neighborhood.csv")
NYC_Neighborhood['geometry'] = gpd.GeoSeries.from_wkt(NYC_Neighborhood['the_geom'])
NYC_Neighborhood = gpd.GeoDataFrame(NYC_Neighborhood, geometry='geometry').set_crs(epsg=4326)

# Cultural Amenities Load Data
NYC_art_galleries = gpd.read_file("./Final_Data/1/art galleries.geojson").set_crs(epsg=4326)
NYC_museums = gpd.read_file("./Final_Data/1/museums.geojson").set_crs(epsg=4326)
NYC_library = gpd.read_file("./Final_Data/1/libraries.geojson").set_crs(epsg=4326)
NYC_theaters = gpd.read_file("./Final_Data/1/Theaters.geojson").set_crs(epsg=4326)

NYC_art_galleries = NYC_art_galleries[['name','zip','address1','geometry']]
NYC_art_galleries.rename(
    columns={"address1": "Address", "name": "Name", "zip": "Zip"},
    inplace=True,)

NYC_museums = NYC_museums[['name','zip','adress1','geometry']]
NYC_museums.rename(
    columns={"adress1": "Address", "name": "Name", "zip": "Zip"},
    inplace=True,)

NYC_library = NYC_library[['name','zip','streetname','geometry']]
NYC_library.rename(
    columns={"streetname": "Address", "name": "Name", "zip": "Zip"},
    inplace=True,)

NYC_theaters = NYC_theaters[['name','zip','address1','geometry']]
NYC_theaters.rename(
    columns={"address1": "Address", "name": "Name", "zip": "Zip"},
    inplace=True,)


# Aggregate all 
NYC_art_galleries.loc[:,"Type"]= "Art Gallery"
NYC_museums.loc[:,"Type"]= "Museums"
NYC_library.loc[:,"Type"]= "Libraries"
NYC_theaters.loc[:,"Type"]= "Theatre"

# Cultural Amenities
NYC_amenities = pd.concat([NYC_art_galleries, NYC_museums, NYC_library, NYC_theaters])

1. Distance to Metro / Tube Stations

Given metro and tube (the subways) are one of the most common modes of traveling in NYC and London, the first section is to look at to what extent do cultural infrastructure falls in walkable distance from a metro or tube station. The NYC dashboard shows the amenities that are located within 2-minute, 5 minutes, and 10-minute walkshed buffering, and the London one on the other hand shows 5-minute, 10 minutes, and 15-minute buffers. This decision is made partially due to the fact that the Greater London area is a lot larger than NYC. We can see that most NYC amenities falls within the 10-minute walking buffer and most London ones fall within 15-minute buffer, showing their great accessibility

1.1 NYC

Code
NYC_art = pd.concat([NYC_art_galleries, NYC_museums])
Code
NYC_Subway = gpd.read_file("./Final_Data/2/MTA Subway Stations.geojson")
Code
# Two minute Buffer
two_min = NYC_Subway.to_crs(epsg=3857).buffer(150)
two_min_buffer= gpd.GeoDataFrame(geometry=two_min).set_crs(epsg=3857)

two_min_union= unary_union(two_min_buffer['geometry'])
union_2_NYC= gpd.GeoDataFrame(geometry=[two_min_union]).set_crs(epsg=3857).to_crs(epsg=4326)

# Five minute Buffer
five_min = NYC_Subway.to_crs(epsg=3857).buffer(400)
five_min_buffer= gpd.GeoDataFrame(geometry=five_min).set_crs(epsg=3857)

five_min_union= unary_union(five_min_buffer['geometry'])
union_5_NYC= gpd.GeoDataFrame(geometry=[five_min_union]).set_crs(epsg=3857).to_crs(epsg=4326)

# Ten minute Buffer
ten_min = NYC_Subway.to_crs(epsg=3857).buffer(800)
ten_min_buffer= gpd.GeoDataFrame(geometry=ten_min).set_crs(epsg=3857)

ten_min_union= unary_union(ten_min_buffer['geometry'])
union_10_NYC= gpd.GeoDataFrame(geometry=[ten_min_union]).set_crs(epsg=3857).to_crs(epsg=4326)
Code
NYC_art['Buffer_2_min'] = NYC_art['geometry'].apply(lambda point: 'Yes' if any(union_2_NYC['geometry'].contains(point)) else 'No' )
NYC_art['Buffer_5_min'] = NYC_art['geometry'].apply(lambda point: 'Yes' if any(union_5_NYC['geometry'].contains(point)) else 'No' )
NYC_art['Buffer_10_min'] = NYC_art['geometry'].apply(lambda point: 'Yes' if any(union_10_NYC['geometry'].contains(point)) else 'No' )
NYC_art_melt = NYC_art.melt(id_vars=['Name', 'geometry', 'Address'], value_vars=['Buffer_2_min', 'Buffer_5_min', 'Buffer_10_min'], var_name='Buffer')
Code
buffers = ['Buffer_2_min', 'Buffer_5_min', 'Buffer_10_min']
bufferSelect = pn.widgets.Select(value='Buffer_2_min', options=buffers, name="Buffer")


# plot data on a map

def plot_galleries(data, selected_buffer):
    m = data.explore(column='value', tiles='Carto DB Positron')
    return m

# Create Dashboard

def create_dashboard_NYC(selected_buffer):
    galleries = NYC_art_melt.loc[NYC_art_melt['Buffer'] == selected_buffer]
    m = plot_galleries(galleries, selected_buffer)
    return pn.pane.plot.Folium(m, height=700) 


dashboard_NYC = pn.Column(
    pn.Column("Subway Walking Distrance to Galleries, NYC", bufferSelect),
    pn.Spacer(height=30),
    pn.bind(create_dashboard_NYC, selected_buffer=bufferSelect)
)
Code
dashboard_NYC

1.2 London

Code
London_metro = gpd.read_file("./Final_Data/2/london-underground.geojson")
London_art = gpd.read_file("./Final_Data/2/London_Art.geojson")
Code
# Five minute buffer
london_five_min = London_metro.to_crs(epsg=3857).buffer(400)
london_five_min_buffer = gpd.GeoDataFrame(geometry=london_five_min).set_crs(epsg=3857)
london_five_min_union = unary_union(london_five_min_buffer['geometry'])
union_5_London = gpd.GeoDataFrame(geometry=[london_five_min_union]).set_crs(epsg=3857).to_crs(epsg=4326)

# Ten minute buffer
london_ten_min = London_metro.to_crs(epsg=3857).buffer(800)
london_ten_min_buffer = gpd.GeoDataFrame(geometry=london_ten_min).set_crs(epsg=3857)

london_ten_min_union = unary_union(london_ten_min_buffer['geometry'])
union_10_London = gpd.GeoDataFrame(geometry=[london_ten_min_union]).set_crs(epsg=3857).to_crs(epsg=4326)

# Fifteen minute buffer
london_fifteen_min = London_metro.to_crs(epsg=3857).buffer(1200)
london_fifteen_min_buffer = gpd.GeoDataFrame(geometry=london_fifteen_min).set_crs(epsg=3857)

london_fifteen_min_union = unary_union(london_fifteen_min_buffer['geometry'])
union_15_London = gpd.GeoDataFrame(geometry=[london_fifteen_min_union]).set_crs(epsg=3857).to_crs(epsg=4326)
Code
London_art['Buffer_5_min'] = London_art['geometry'].apply(lambda point: 'Yes' if any(union_5_London['geometry'].contains(point)) else 'No' )
London_art['Buffer_10_min'] = London_art['geometry'].apply(lambda point: 'Yes' if any(union_10_London['geometry'].contains(point)) else 'No' )
London_art['Buffer_15_min'] = London_art['geometry'].apply(lambda point: 'Yes' if any(union_15_London['geometry'].contains(point)) else 'No' )
London_art_melt = London_art.melt(id_vars=['Name', 'geometry', 'Address'], value_vars=['Buffer_5_min', 'Buffer_10_min', 'Buffer_15_min'], var_name='Buffer')
Code
buffers_london = ['Buffer_5_min', 'Buffer_10_min', 'Buffer_15_min']
bufferSelect_london = pn.widgets.Select(value='Buffer_5_min', options=buffers_london, name="Buffer")


# plot data on a map

def plot_galleries(data, selected_buffer):
    m = data.explore(column='value', tiles='Carto DB Positron')
    return m

# Create Dashboard

def create_dashboard_London(selected_buffer):
    galleries = London_art_melt.loc[London_art_melt['Buffer'] == selected_buffer]
    m = plot_galleries(galleries, selected_buffer)
    return pn.pane.plot.Folium(m, height=700) 


dashboard_London = pn.Column(
    pn.Column("Subway Walking Distrance to Galleries, London", bufferSelect_london),
    pn.Spacer(height=30),
    pn.bind(create_dashboard_London, selected_buffer=bufferSelect_london)
)
Code
dashboard_London

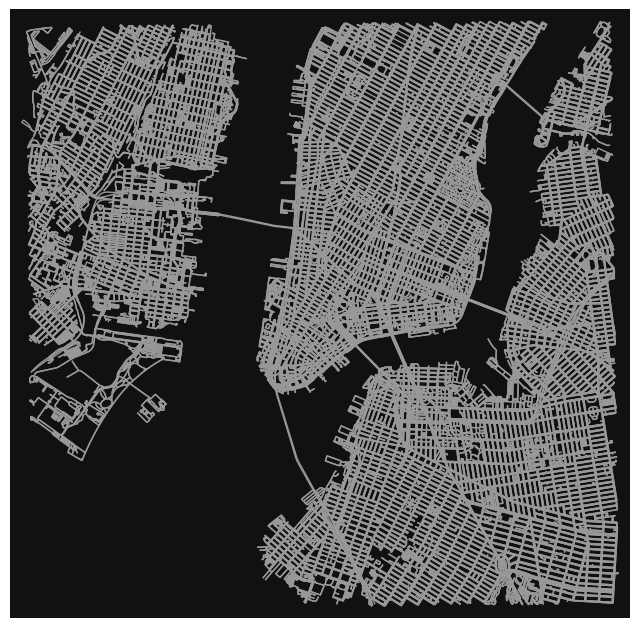
2. OSM network Analysis of NYC

Another potential way to judge their accessibility to outside travelers is through OSM network analysis. Here, I’m using JFK airport and the cultural centers in Manhattan as an example. Since most people travel via metro within the city, and only a good number of tourists traveling from the airport drives or take uber to travel into the city, it makes the most sense to have JFK airport as the node of origin and accessing accessibility of all amenities from the airport. The result is shown in the table. However, the result of calculation might be a bit off, considering NYC’s traffic condition….

Code
NYC.head()
geometry bbox_north bbox_south bbox_east bbox_west place_id osm_type osm_id lat lon class type place_rank importance addresstype name display_name
0 MULTIPOLYGON (((-74.25884 40.49887, -74.25814 ... 40.91763 40.476578 -73.700233 -74.258843 371663561 relation 175905 40.712728 -74.006015 boundary administrative 10 0.817577 city New York New York, United States
Code
graph = ox.graph_from_address("NYC, NY", dist=5000)
NYC_graph = ox.project_graph(graph)
ox.plot_graph(NYC_graph, node_size=0)

(<Figure size 800x800 with 1 Axes>, <Axes: >)
Code
airport = gpd.read_file("./Final_Data/2/Airport Point.geojson")
NYC_Neighborhood = pd.read_csv("./Final_Data/1/2020 Neighborhood.csv")
NYC_Neighborhood['geometry'] = gpd.GeoSeries.from_wkt(NYC_Neighborhood['the_geom'])
NYC_Neighborhood = gpd.GeoDataFrame(NYC_Neighborhood, geometry='geometry').set_crs(epsg=4326)

# Spatial Join
art_geo = gpd.sjoin(
    NYC_art_1,  
    NYC_Neighborhood.to_crs(NYC_art_1.crs),  
    predicate="within",
    how="left",
)


NYC_art_manhattan = art_geo.loc[art_geo['BoroName'] == 'Manhattan']
NYC_museums_manhattan = NYC_art_manhattan.loc[NYC_art_manhattan['Type'] == 'Museums']
Code
manhattan = NYC_Neighborhood.loc[NYC_Neighborhood['BoroName'] == 'Manhattan']
manhattan = manhattan.dissolve()
manhattan_outline = manhattan.squeeze().geometry
Code
jfk = airport.loc[airport['name'] == 'John F. Kennedy International Airport']
Code
import networkx as nx
from shapely.geometry import Point, box
Code
graph = manhattan
orig_node = NYC_museums_manhattan[] shortest node
airport_node = jfk[] nearest node 
Code
NYC_museums_manhattan = NYC_museums_manhattan[NYC_museums_manhattan.within(manhattan.geometry.iloc[0])]
Code
NYC_museums_manhattan = NYC_museums_manhattan[['Name', 'Address', 'geometry']]

NYC_museums_manhattan = NYC_museums_manhattan.loc[NYC_museums_manhattan['Name'] != 'Ellis Island Museum']
NYC_museums_manhattan = NYC_museums_manhattan.loc[NYC_museums_manhattan['Name'] != 'American Immigration History Center']
Code
convert to crs with meters - .geometry.distance (from JFK) 
Code
# impute speed on all edges missing data
graph = ox.add_edge_speeds(graph)

# calculate travel time (seconds) for all edges
graph = ox.add_edge_travel_times(graph)
Code
def calculate_distance(row):
    destination_point = row['geometry']

    # Find the nearest nodes on the graph for the airport and destination points
    orig_node = ox.distance.nearest_nodes(graph, jfk.geometry.x, jfk.geometry.y)
    destination_node = ox.distance.nearest_nodes(graph, destination_point.x, destination_point.y)

    # Initialize airport_node for each row
    airport_node = ox.distance.nearest_nodes(graph, jfk.geometry.x, jfk.geometry.y)

    # Initialize variable
    shortest_travel_time = None

    # Check if there is a path before calculating
    if nx.has_path(graph, airport_node, destination_node):
        shortest_travel_time = nx.shortest_path_length(graph, airport_node, destination_node, weight='travel_time')

    return shortest_travel_time


# Assuming jfk is the airport information for the first row
jfk = jfk.iloc[0]

# Apply the function to calculate shortest travel time for each row
NYC_museums_manhattan['shortest_travel_time'] = NYC_museums_manhattan.apply(calculate_distance, axis=1)
Code
NYC_museums_manhattan['shortest_travel_time (in Minute)'] = NYC_museums_manhattan['shortest_travel_time'] / 60
Code
NYC_museums_manhattan.head()
Name Address geometry shortest_travel_time shortest_travel_time (in Minute)
0 Alexander Hamilton U.S. Custom House 1 Bowling Grn POINT (-74.01376 40.70382) 739.8 12.330000
2 American Academy of Arts and Letters 633 W. 155th St. POINT (-73.94730 40.83385) 982.3 16.371667
3 American Folk Art Museum 45 West 53rd Street POINT (-73.97810 40.76162) 1043.4 17.390000
5 American Museum of Natural History Central Park West at 79th Street POINT (-73.97365 40.78083) 1040.7 17.345000
6 American Numismatic Society 75 Varick St POINT (-74.00701 40.72353) 703.7 11.728333